This is a part of a series of posts analyzing the 2010 midterm elections. This post will analyze the Ohio gubernatorial election, in which Republican John Kasich narrowly defeated Democrat Ted Strickland.
Ohio’s Gubernatorial Election
In most of the 2010 midterm elections, Democratic performances were strikingly similar to President Barack Obama’s performance in 2008. If a place had generally voted Democratic in the past, but didn’t vote for Mr. Obama – it tended not to vote Democratic in 2010 either. An example of this is southwest Pennsylvania. The same holds true for places that generally voted Republican in the past but went for Mr. Obama this time (e.g. the Houston and Salt Lake City metropolitan areas.)
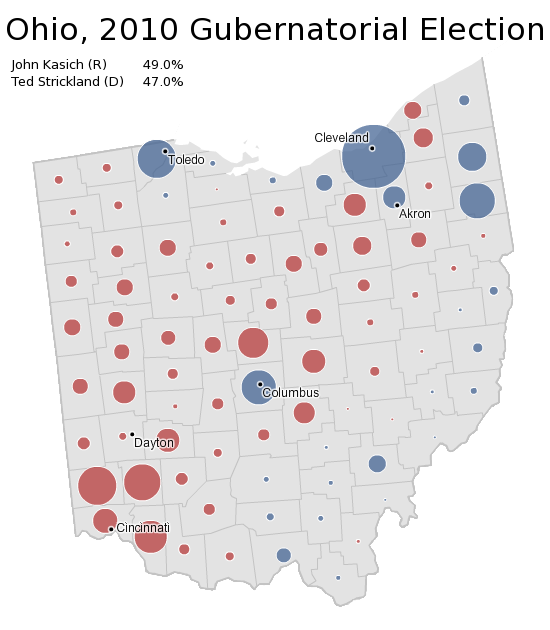
Ohio’s gubernatorial election was an exception to this trend. Democratic former Governor Ted Strickland built a very traditional Democratic coalition in Ohio:
More below.
(A note: Credit for the first three maps in this post goes to the New York Times.)
This map is strikingly similar to previous Democratic performances in Ohio, and less similar to Mr. Obama’s. Mr. Obama did unusually well in Columbus and Cincinnati and unusually badly in the Ohio’s northeast unionized industrial corridor. Mr. Strickland depended less on Columbus and Cincinnati and more on the northeast.
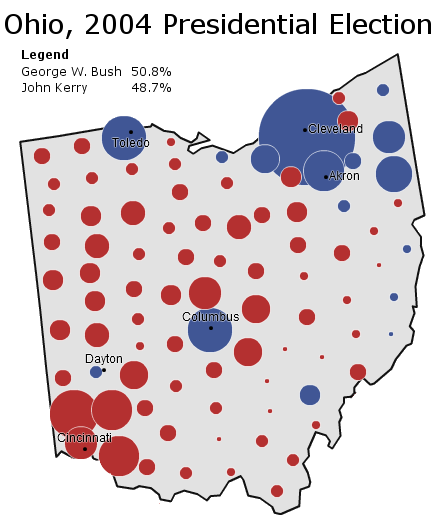
Ohio’s 2010 gubernatorial election looks very similar to previous elections. Here, for instance, is President George W. Bush in 2004:
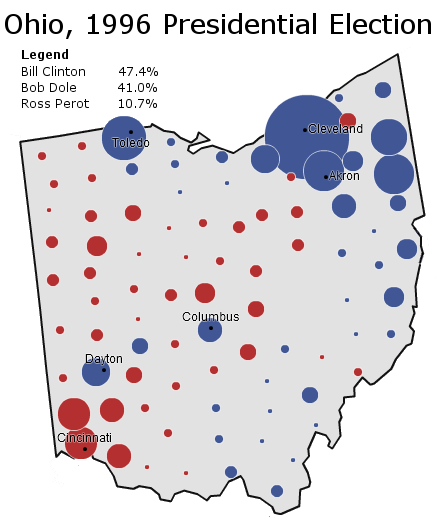
Even more similarly, we can look at President Bill Clinton’s victory in 1996. Of course, Mr. Clinton won Ohio by a decent margin while Mr. Strickland lost. But if you simply imagine the Republican margins widening and the Democratic margins decreasing, you get something very similar to Mr. Strickland’s map:
One can go further back – to the 1976 presidential election or even the 1940 presidential election – and get similar results. (Note that in the link for the 1976 presidential election, blue indicates Republican victories while red indicates Democratic victories; this is the opposite of the norm.)
Republican Governor John Kasich thus won a victory based off electoral patterns more than three generations old.
Two Unusual Patterns
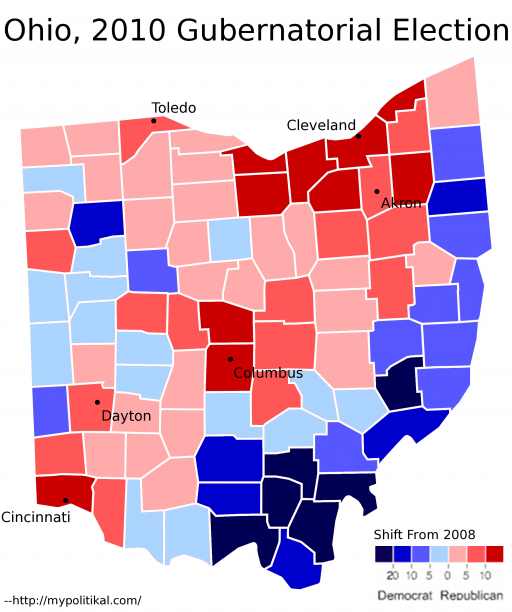
Let’s compare Mr. Kasich’s performance with Senator John McCain’s performance:
This is a very unusual map. When most Republicans win, Republican strongholds shift more to the Republican candidate, while Democratic strongholds shift less.
This did not happen with Mr. Kasich. Rather, Mr. Kasich seems to have improved the most in the more populated areas of Ohio (Cincinnati, Columbus, and Cleveland). He actually does worse than Mr. McCain in a number of Republican counties.
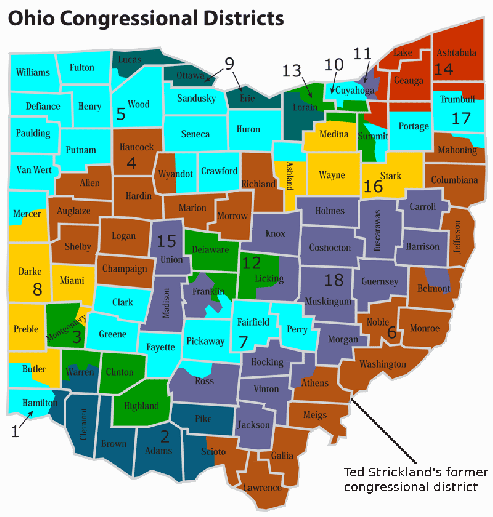
Notice also how Mr. Strickland improves upon Mr. Obama along the southeastern border of Ohio. This is not an accident; Mr. Strickland’s area of improvement directly traces the old congressional district he represented before becoming governor.
Here is a map of Ohio’s congressional districts. Mr. Strickland represented the 6th congressional district in the map:
There is one final interesting note about the 2010 Ohio gubernatorial election. Republican candidate John Kasich lost much of Appalachian southeastern Ohio. This is a rare occurrence; that part of Ohio is economically liberal but socially conservative and quite poor. It usually votes Republican but will occasionally go for a Democratic candidate.
Generally, this only happens when the Republican candidate is losing. That Mr. Kasich lost southeastern Ohio but still won the state is a rare thing.
The Democratic Party is in trouble in this part of America; it has gone from Clinton country to one of the few areas where Barack Obama did worse than John Kerry. The Democratic officeholders in this region are gradually being swept out of office.
Yet Mr. Strickland was able to win soundly in Appalachian Ohio, despite losing the state during the strongest Republican wave in a generation. That is quite a unique accomplishment. It offers a ray of hope to Democrats in Appalachian America.
–Inoljt
