This is the second part of two posts describing a fascinating election in Georgia: the 1980 Senate election, in which Republican Mack Mattingly beat scandal-ridden Democrat Herman Talmadge. This was the first time that a Republican Senator was elected in Georgia for more than a century. Even more interestingly, the areas that the Democratic candidate won tend to vote strongly Republican today, and vice versa.
The Black Vote in 1980
The previous post ended by bringing up the role of the black vote:
In 1980 Republican candidate Mack Mattingly won areas with substantial black populations, most notably the heavily-black city of Atlanta itself. Surely Democratic Senator Herman Talmadge’s dedicated support to segregation wouldn’t have appealed to the black vote.
So did Republicans win the black vote in this 1980 election?
More below.
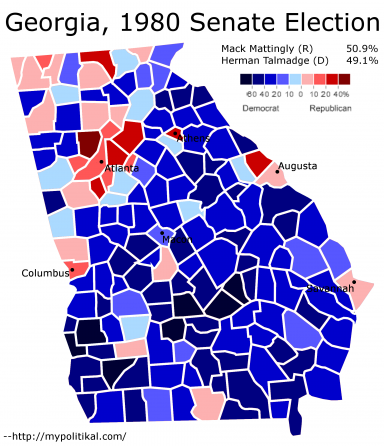
Well, let’s take a look at the 1980 Georgia Senate election:
This map puts the election in more detail than the maps in the previous post. It’s pretty difficult to determine how any group voted knowing only whether a party won or lost a county, but not by how much they lost the county. This map is more useful.
Here we see a Georgia in which Republican strength in the cities just barely overwhelms Democratic rural strength. Again, this runs strongly against the usual pattern today, in which Democratic urban strength is pitted against Republican rural strength. (For instances of the latter, see these elections in Florida, Illinois, Ohio, Pennsylvania, Texas, and Virginia).
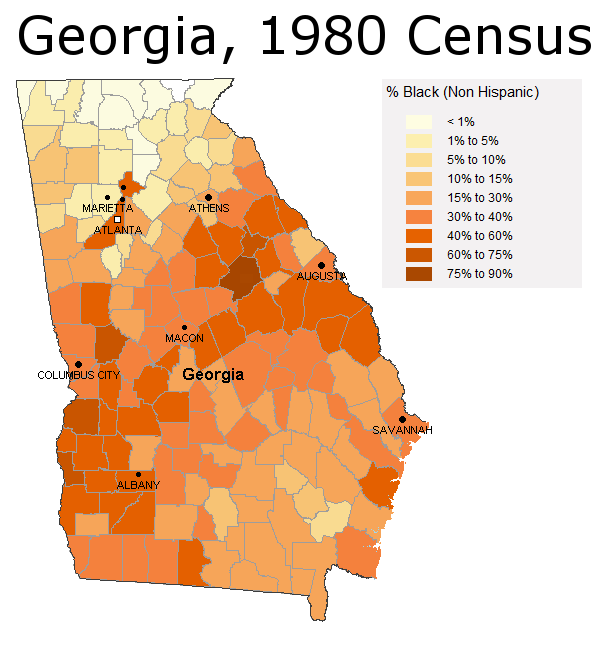
Now let’s take a look at the black population of Georgia:
This is a map of the black population in each county of Georgia, according to the 1980 Census. It’s taken from The Social Explorer.
There doesn’t seem to be much of a link. The rural black areas vote strongly Democratic, and so do the rural white areas. Urban black Atlanta votes strongly Republican, and so do the urban non-black parts of Atlanta.
This is actually somewhat disappointing; I expected a stronger correlation before making these maps.
The Black Vote in 2008
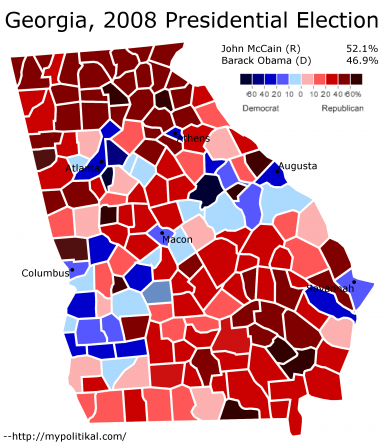
Here, for instance, is a map in which the black vote certainly does have a relationship with how well one party does:
This was the 2008 presidential election. Note how the map is almost the opposite of the 1980 Senate election.
Even though the 1980 Census data is more than a generation out-of-date, there’s still a very strong link between how black a county was in 1980 and the percent of the vote the Democratic candidate won in 2008. The discrepancies can largely be explained by demographic changes (for instance, Clayton County – the county directly below the dot indicating Atlanta – voted strongly for Obama not because white people there really really liked him, but because it has become 65% black today).
Conclusions
There are several possibilities why we don’t see any such correlation in the 1980 Senate election. Perhaps black turn-out was still very far below white turn-out in 1980 (only 15 years after the passage of the 1965 Voting Rights Act). If this is true, then the black vote would have been overwhelmed by higher turn-out amongst whites.
It’s also possible that running a regression analysis could provide more insight into the black vote. The results, however, would probably differ greatly one whether one adjusts for the amount of people living in each county. And they might not be statistically significant.
All in all, it is possible to tell how blacks voted in 1980; one just needs more detailed data. You need to look at precinct data (data detailed enough to show how groups of several hundred people voted) and then look at how the precincts with the highest black percentages voted. This, unfortunately, is data that is extremely difficult, time-consuming, and expensive to gather.
So did Republicans win the black vote in this 1980 election?
Until we have more information, the answer is: we don’t know.
–inoljt


2 comments